I’ve spent quite a lot of time in my professional career thinking about why companies don’t pay invoices on time. As a finance director and as a freelancer, I have experience of both sides of the fence.
I’ve written this post to help freelancers understand the blocks that they might face and how to overcome them.
I recently designed and delivered some Excel training for auditors. Specifically, it was Excel training for audit trainees who had just started at the firm.
I benefitted enormously at the start of my career when my employer arranged for all new audit trainees to have Excel training as part of our induction. Even though it was pretty basic, it established a good grounding in things like formula construction, absolute and relative cell references, and a few shortcuts.
My bike next to the River Thames, somewhere near Chertsey, on the Great Western Way
Last month I fulfilled a long-held ambition by cycling from Bristol to London using (mostly) the Great Western Way. As I couldn’t find many first hand posts about other people doing this, I thought I’d write one.
Warning: This post has no Excel or finance content whatsoever.
I asked on LinkedIn the other day whether people would be interested in my method for posting monthly irrecoverable VAT adjustments and was pleasantly surprised by the responses.
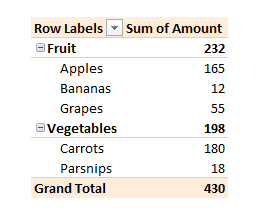
If your pivot table defaults to Count instead of Sum, then you have inconsistent numerical data.
I found this out on a webinar about five years ago, and it still seems to be a mostly unknown feature.
And yes, I call it a feature, not a bug, because it is ultimately helping you.
Pivot table showing a Sum of Amounts column. If this defaults to Count, watch out!
What it is doing is giving you an immediate message that your numerical data has gaps, or perhaps has numbers formatted as text, or other errors. If you ignore this, you might produce inaccurate analysis.
So – if your pivot table defaults to Count, don’t do what I used to do, which was to tut and manually change it to Sum.
We’ve had a smart meter for over a year now and it has led to a 20% reduction in our electricity use.
We had thought we ran a pretty efficient household, at least on the electricity front. From analysing bills before we had the smart meter, I estimated we were using 5-6 units a day, which is well below the “average energy use” that you hear so much about. We always used less than those helpful energy providers predicted, anyway.
However, the smart meter gave us (a) more data and (b) more ways to look at that data. One thing that became clear fairly quickly was that we were using almost as much electricity when we were out of the house than when we were in it.
We became religious about switching things off at the wall, particularly when going away for a day or more. This is what has made the biggest impact, which surprised me, as I thought that all of our devices were energy efficient.
It also helped to pinpoint particular devices that use more power. It wasn’t surprising to see that the oven and the washing machine were power suckers, but the daylight lamp bulb was a nasty shock.
Having good data saves money, particularly if you know how to analyse it!