If your pivot table defaults to Count instead of Sum, then you have inconsistent numerical data.
I found this out on a webinar about five years ago, and it still seems to be a mostly unknown feature.
And yes, I call it a feature, not a bug, because it is ultimately helping you.
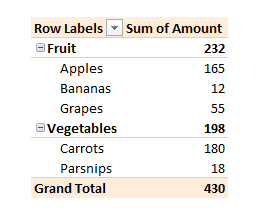
Pivot table showing a Sum of Amounts column. If this defaults to Count, watch out!
What it is doing is giving you an immediate message that your numerical data has gaps, or perhaps has numbers formatted as text, or other errors. If you ignore this, you might produce inaccurate analysis.
So – if your pivot table defaults to Count, don’t do what I used to do, which was to tut and manually change it to Sum.
On the face of it, processing timesheets with Power Query ought to be fairly straightforward. By “processing timesheets” I am primarily thinking about records of hours worked that feed into payroll or job costing calculations.
How to change the layout of your pivot table – one of many things I learned at the Global Excel Summit
Last week I “went” to the Global Excel Summit. This is a three day event featuring many of the superstars of Excel, eg Leila Gharani, Chandoo, Wyn Hopkins, Oz du Soleil etc etc. It was virtual this year, but as I’d never been before I didn’t know what to expect anyway.
I learned way more than five things, of course, but here are my biggest takeaways.
This post sets out the five most useful new Excel functions for finance teams, based on my experience. By “new” I mean available in 2019 or later versions of Excel (including Office 365).
Note – this post was written in January 2022 and reflects what was available at that time.
Many of us are self-taught in Excel, and it can be hard to keep up with the changes. In the past few years there have been loads of new Excel functions that replace and add to existing ones that you might be familiar with.
Here are the five most useful power query functions for accountants, in my personal opinion:
Extract
Conditional Columns
Merge Queries
Data from Folder
Unpivot
It is, of course, impossible to pick just five. However, the point of this post is to illustrate that the power query functions I use the most are actually the simple ones. They are still enormous timesavers. Let’s have a look.
I attended an excellent livestream last week about Excel dashboards, presented by the legendary Chandoo. In his tutorial, he built a KPI dashboard in Excel in around an hour. As well as learning lots of useful tips, it also made me think about the key skills (Excel and otherwise) that you need to build a great dashboard.
Power Query has been out for over a decade and yet the majority of accountants I meet still seem unaware of what it can do for them.
A possible issue is that it is usually presented in the context of Power BI, and analysing Big Data. And the type of people who like to talk about that also like to talk about other scary things such as VBA and SQL. There aren’t many training resources or articles focussing on Power Query for accountants more generally.